
Year 5 Statistics – Using line graphs to solve problems – Lesson 3
Downloads are for members of Grammarsaurus only.
Grammarsaurus Gold Subscription - $59.00
Grammarsaurus Gold Subscription - $59.00
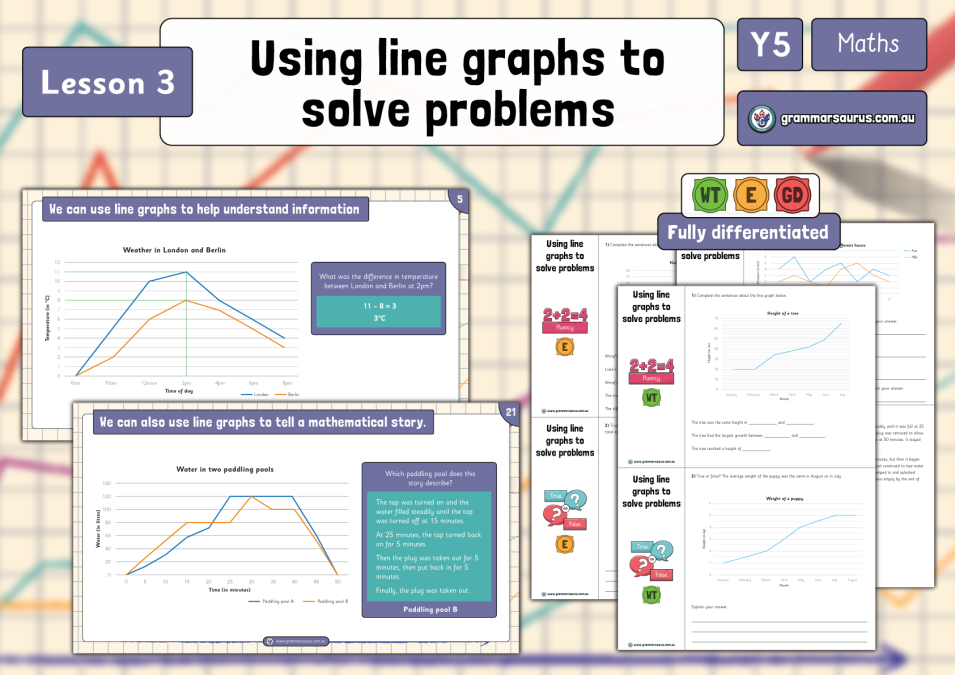
Lesson 3 In this lesson, children will use what they have learnt about line graphs to solve problems. There is a teaching presentation accompanied by differentiated activities with a range of fluency, reasoning and problem-solving questions. Year 5 Mathematics Content Descriptors V8.4 Construct displays, including column graphs, dot plots and tables, appropriate for data type, with and without the use of digital technologies ACMSP119 V9 interpret line graphs representing change over time; discuss the relationships that are represented and conclusions that can be made AC9M5ST02 plan and conduct statistical investigations by posing questions or identifying a problem and collecting relevant data; choose appropriate displays and interpret the data; communicate findings within the context of the investigation AC9M5ST03 Differentiation: There are three levels of differentiation in this pack: ‘working towards,’ ‘expected’ and ‘greater depth’. Level of this Pack: Age: 10-11 Australia: Grade 5 ...
Hello,
Downloads are for members of Grammarsaurus only.
Please sign up below or login if you are already a member.


